It seems that little is known, by many radio amateurs, of Ionograms, or of the Ionosonde network, including a huge amount of work done by the Rutherford Appleton Laboratories.
Before reading any further, please note that none of the following is my work. It is just a collection of information I have found which is already on the web, brought together for ease of use. Happy reading, - Steve (g0lfp)
From: http://www.ips.gov.au/IPSHosted/INAG/uag.htm
The URSI Handbook for Ionogram Interpretation contains the agreed standard rules for interpreting ionograms. The publication is known to many as UAG-23A - the volume number it had in the WDC-A for STP publication series on the Upper Atmosphere and Geophysics (UAG). All ionogram interpretation and ionospheric characteristics derived from ionograms are referenced to it.
These rules and conventions have been used, with refinements, since the International Geophysical Year (IGY), 1957-58 when they were produced by "The World Wide Soundings Committee". The first "URSI Handbook of Ionogram Interpretation and Reduction" by W. R. Piggott and K. Rawer was published by Elsevier in 1961. In 1972 the second edition was published as UAG-23. In addition to manual scaling rules for vertical incident ionograms, both documents offered a number of useful discussions about handling ionospheric data, with specific reference to ionogram reduction. UAG-23A, a revision of the first four sections of UAG-23, was also published in 1972. The majority of manual ionogram reduction carried out in the world uses the rules suggested in these publications.
UAG-23A is more than a set of rules and to think of it this way is to miss a vital point. It outlines a number of ways in which ionograms can be interpreted, leaving much latitude for station networks to develop their own basis for interpreting their ionograms. A manual scaler, familiar with UAG-23A advice, can take a complex ionogram, recognise and identify unusual features, thereby developing a consistent interpretation of the ionogram. Using this information, the main characteristics of the ionogram are then scaled. Ideally, any other manual scaler confronted with a similar ionogram will come to the same reasonable interpretation and the resultant scaled characteristics will be comparable between ionosonde networks.
Hard copies of UAG-23A are becoming scarce, yet its value remains as great today as it did when it first appeared. To make this important information available as widely as possible, here is a scanned version.
UAG-23A: URSI Handbook of Ionogram Interpretation and Reduction (second edition)
From: http://www.ukssdc.ac.uk/ionosondes/ionosonde_basics.html
The path of a radio wave is affected by any free charges in the medium through which it is travelling. The refractive index is governed by the electron concentration and the magnetic field of the medium and the frequency and polarisation of the transmitted wave. These lead to some important properties for waves propagating in the ionosphere;
* The refractive index is proportional to the electron concentration.
* The refractive index is inversely proportional to the frequency of the transmitted
wave.
* There are two possible ray paths depending on the sense of polarisation of
the transmitted wave. This is a result of the magnetic field, which causes the
ionosphere to be birefringent. The two rays are referred to as the ordinary
and extraordinary components.
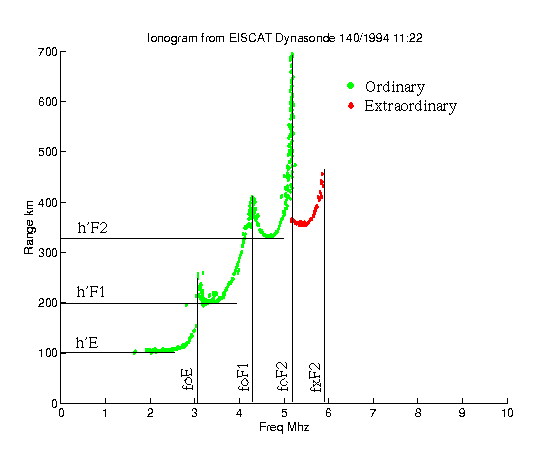
The ionisation in the atmosphere is in the form of several horizontal layers, and so the electron concentration and therefore the refractive index of the ionosphere vary with height. By broadcasting a range of frequencies, and measuring the time it takes for each frequency to be reflected, it is possible to estimate the concentration and height of each layer of ionisation.
An ionosonde broadcasts a sweep of frequencies, usually in the range of 0.1 to 30 MHz. As the frequency increases, each wave is refracted less by the ionisation in the layer, and so each penetrates further before it is reflected. As a wave approaches the reflection point, its group velocity approaches zero and this increases the time-of-flight of the signal. Eventually, a frequency is reached that enables the wave to penetrate the layer without being reflected. For ordinary mode waves, this occurs when the transmitted frequency just exceeds the peak plasma frequency of the layer. In the case of the extraordinary wave, the magnetic field has an additional effect, and reflection occurs at a frequency that is higher than the ordinary wave by half the electron gyrofrequency.
The frequency at which a wave just penetrates a layer of ionisation is known as the critical frequency of that layer. The critical frequency is related to the electron density by the simple relation;
F_c = 8.98*sqrt(Ne) for the ordinary mode.
and
F_c = 8.98*sqrt(Ne) + 0.5*Be/m for the extraordinary mode.
Here F_c is the critical frequency in Hz, Ne is the electron concentration per metre cubed, B is the magnetic field strength, e is the charge on an electron and m is the mass of an electron.
All transmitted frequencies above this critical frequency will penetrate the layer without being reflected. Their group velocity will however, will be slowed by any ionisation, and this will add to the time-of-flight. If such a wave encounters another layer, whose plasma frequency is higher than the frequency of the wave, it will be reflected, and the return signal will be further delayed as it travels back through the underlying ionisation. The apparent, or virtual height indicated by this time delay will therefore be greater than the true height. The difference between true-height and virtual height is governed by the amount of ionisation that the wave has passed through. Recreating the true-height profile of electron concentration from ionogram data is an important use of ionosonde data. Such a procedure is known as true height analysis.
Ionospheric parameter codes, from UKSSDC